What Is Data-driven Justice?
What is Data-driven Justice?
One of the main priorities of the European Union for the period
2019-2024 is the so-called "European Data Strategy" as a
driver of innovation and growth.
In the same vein, there is a state strategy that pursues both the design of reference frameworks for data management and the definition of standards for data analysis for administrations in a multilevel system. The primary objective is to have information available for decision-making and the implementation of public policies based on data and evidence.
In the field of Justice, Data-driven Justice is presented as a priority project for the Administration of Justice, within the framework of co-governance. It has been agreed in the framework of the Sectoral Conference and is addressed from a technical point of view, in the State Technical Committee for Electronic Justice Administration (CTEAJE).
This project, which is part of the roadmap of the Justice 2030/PRTR Plan, aims to create between all the administrations with competences - the General Council of the Judiciary (CGPJ), the State Prosecutor's Office (FGE), inter-administrative bodies such as the National Commission of Judicial Statistics (CNEJ) and other ministries- , an inter-administrative data platform with open access that integrates the different disaggregated and geo-referenced quantitative information systems, both the administrations providing justice and other administrations whose data facilitate management decisions.
Data-driven justice involves:
-
Joint integration of information on a common open platform.
-
Joint definition and refinement of indicators.
-
Use of information.
-
Transparency, publicity, communication and training, through different channels.
-
Regulatory compliance and advocacy initiatives for a data-driven strategy.
The architecture is based on three elements:
1. Data warehouse
It is a model of collaboration between administrations and
organisations to transfer and obtain data in an environment of
collaboration and co-responsibility.

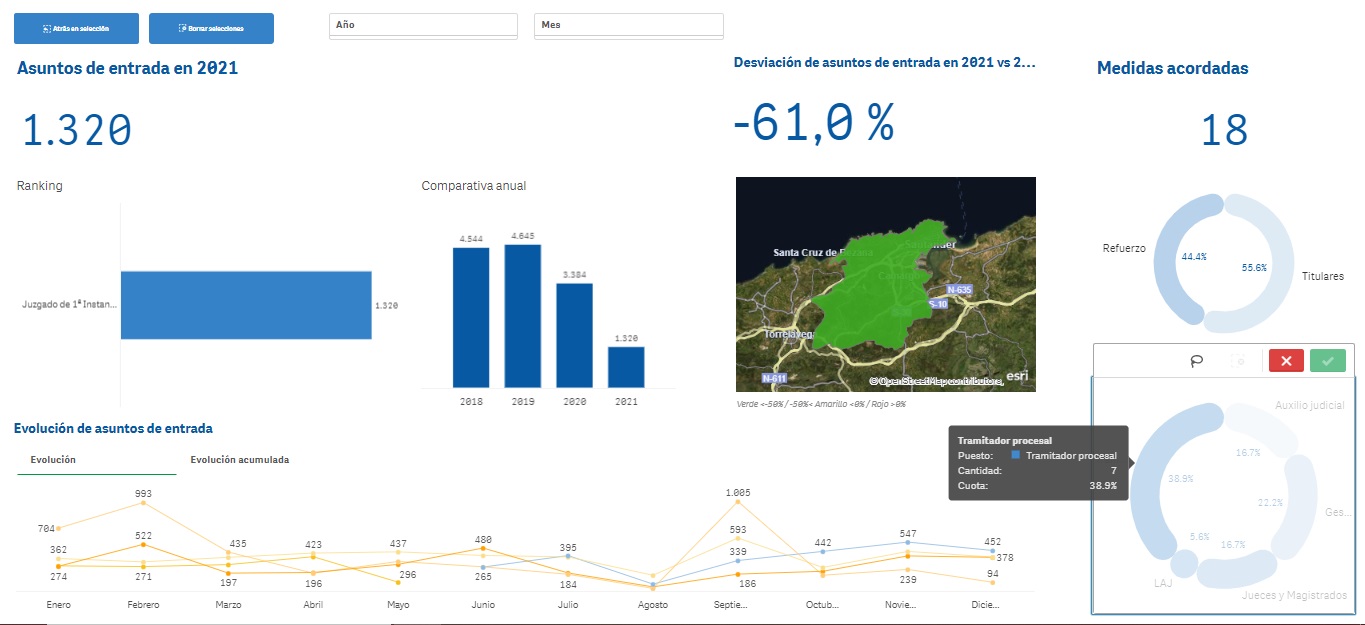
2. Dashboard (Statistical use)
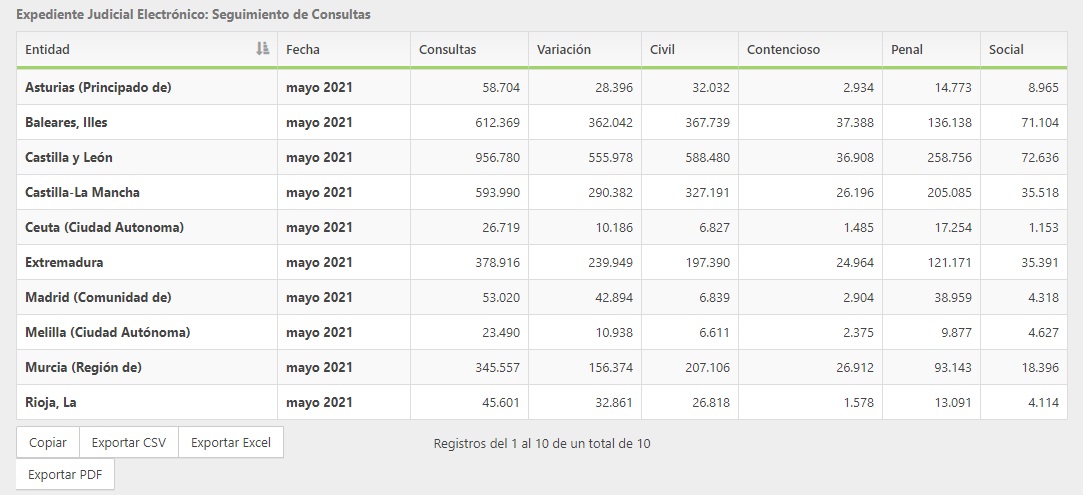
A system of dashboards and use of information, with
visualisations and tabular formats that enable evidence-based public
policy decision making.

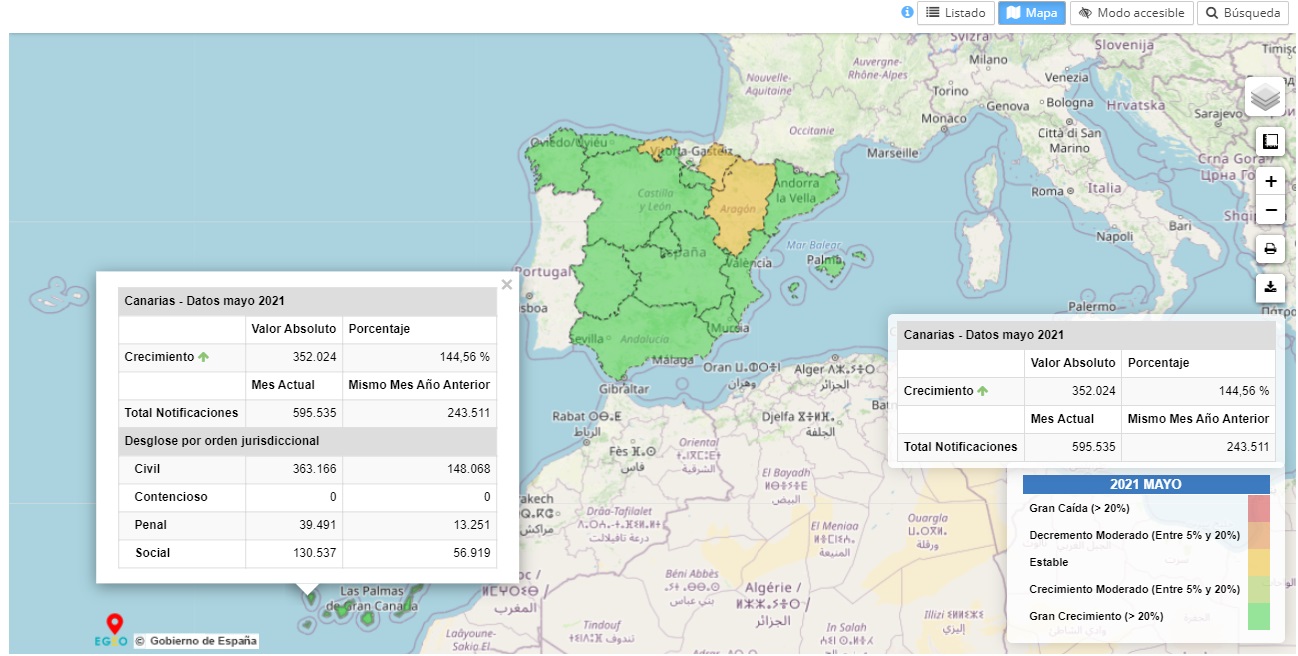
3. Use of geo-referenced information
A geo-referenced information module that allows advanced
visualisations of information. The information system covers the whole
territory, down to the municipality, and advanced operations can also
be considered.

